Devpost
Participate in our public hackathons
Devpost for Teams
Access your company's private hackathons
Grow your developer ecosystem and promote your platform
Drive innovation, collaboration, and retention within your organization
By use case
Blog
Insights into hackathon planning and participation
Customer stories
Inspiration from peers and other industry leaders
Planning guides
Best practices for planning online and in-person hackathons
Webinars & events
Upcoming events and on-demand recordings
Help desk
Common questions and support documentation
Created a machine learning model that analyzes various non-demographic attributes of a loan applicate to compare and predict if the applicant loan will be accepted or rejected.
We used time series model to predict and used streamlit to visiualize them
Goldman Sachs. Code is on Github ANTONIOCABALLERO12
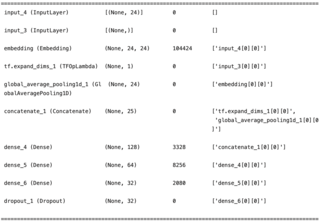
A deep learning model built using Keras that predicts edges between nodes in a network using text features.
We hypothesized that systemic inequalities, particularly race, can significantly impact infrastructure and specifically housing.
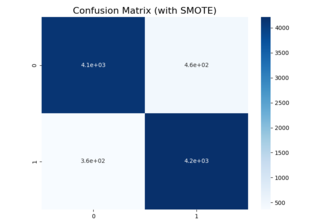
Predicting Mortgage Approval
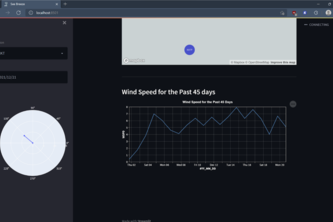
Interactive tool for monitoring and predicting data at NOAA weather buoys around the world.
We paired with Cognite to create a dashboard that loads in realtime to display past and future wind trends.
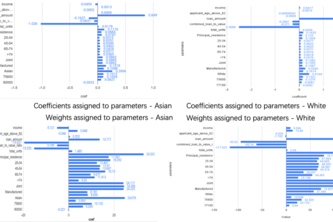
We developed a model that predict the level of interested rate for an approved mortgage, and investigated whether partitioning the dataset by race can improve predictive accuracy.
We are predicting the interest rate on mortgages. Created by Ben Allen, Adam Swartz, Yuv Sachdeva, and Lauren Yu
Building a logistic regression model and improving upon it while producing graphs and charts to investigate broader trends in Houston mortgage approval data
Historical wind data analysis dashboard
We wanted to create a more fair and representative Houston.
Each webpage has a description and type, and they have connections between each other. We sought to predict whether or not a link should exist between nodes when the data set was made more sparse.
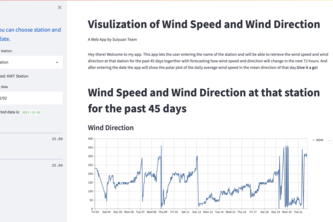
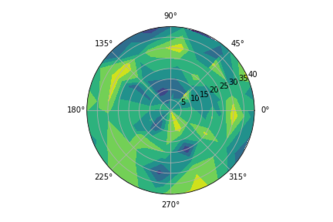
This is an interactive dashboard that provides information about weather patterns at three offshore stations. It produces time series plots as well as daily average polar plots.
Using decision tree classifier to show signs of discrimination in loan process.
We have created multiple programs in Python and R which allows us to visualize the wind speed and wind direction in a time series plot.
Hello, we are AlphaZero - ROP, composed of 4 members, Ishtdeep Singh, Wei Ren Gan, Naman Mohindra, and Abhishek Shah.
Revolutionizing the way businesses match with one another.
Our open source airport and COVID-19 datasets demonstrate both an incontrovertible decline in the travel industry at the dawn of the pandemic as well as a substantial recovery in the past months.
Examining the presence of racial discrimination in the approval of mortgage requests in Harris County, Texas.
Using the provided dataset of mortgage applications in Harris County, TX, our team visualized the data through bar graphs to compare the acceptance rates of applications based off of several factors.
Finding besties for websites with machine learning <3
25 – 47 of 47